.png.7b01ce7357a7730d478c6dae8134de1b.png)
Rousseau
-
Posts
21,219 -
Joined
-
Last visited
-
Days Won
227
Everything posted by Rousseau
-
I agree with you. I think Dessers is wasteful. The xG does not show he is performing 'well'. It shows he is performing slightly below average (a 0.52 difference is not insignificant). It's just that he's not as wasteful as you or I thought he was. Combining the data with what I see, I would suggest that he tends to miss easy chances and score harder chances (e.g. Dundee Utd), which would skew the numbers slightly. He does only average 2-3 shots a game (64 shots he has taken this season) so his misses are more obvious. At the end of the day, 12 goals in 32 league games from a number 9 is not great. It's also more of a problem because no one else is scoring - Dessers is hitting the same numbers, or better, than Morelos (excluding the fact that Morelos was a superior player in all other regards, IMO). It's interesting that you see the variance between the data and what you see and think, 'the data is bollocks'; whereas I see the variance and think, 'let's dig deeper into the context to try explain it.'
-
Ok, apologies. Where's the error? It's based on what has actually happened. I don't know what you mean by 'fact.' It's just the probability. And it is just a discussion point. Let's simplify it and just consider penalties. From the historical data, penalties are scored 79% of the time. You can watch them all back. It gets a value of 0.79 xG. The only fact is that a penalty has been scored 79% of the time in the past. That's indisputable, surely? We then analyse the data by comparing it to what actually happens. (It's the variance that is interesting, as it can be analysed: Are the players rubbish or just unlucky? Are the chances poor quality? Are we not creating enough? Is a player scoring less or more than he should be? Who is getting chances from high xG situations?) A one-off penalty won't tell you much. If after 10 penalties and the player has 2 goals from an xG of 7.9 (10 * 0.79), then he's rubbish. As I've said, the Opta model goes into much, much more detail and volume than what anyone could ever judge with their own eyes. Have a browse of this article, which will explain it better than I ever could: https://theanalyst.com/2023/08/what-is-expected-goals-xg
-
It only compares shots. Nothing more, nothing less.
-
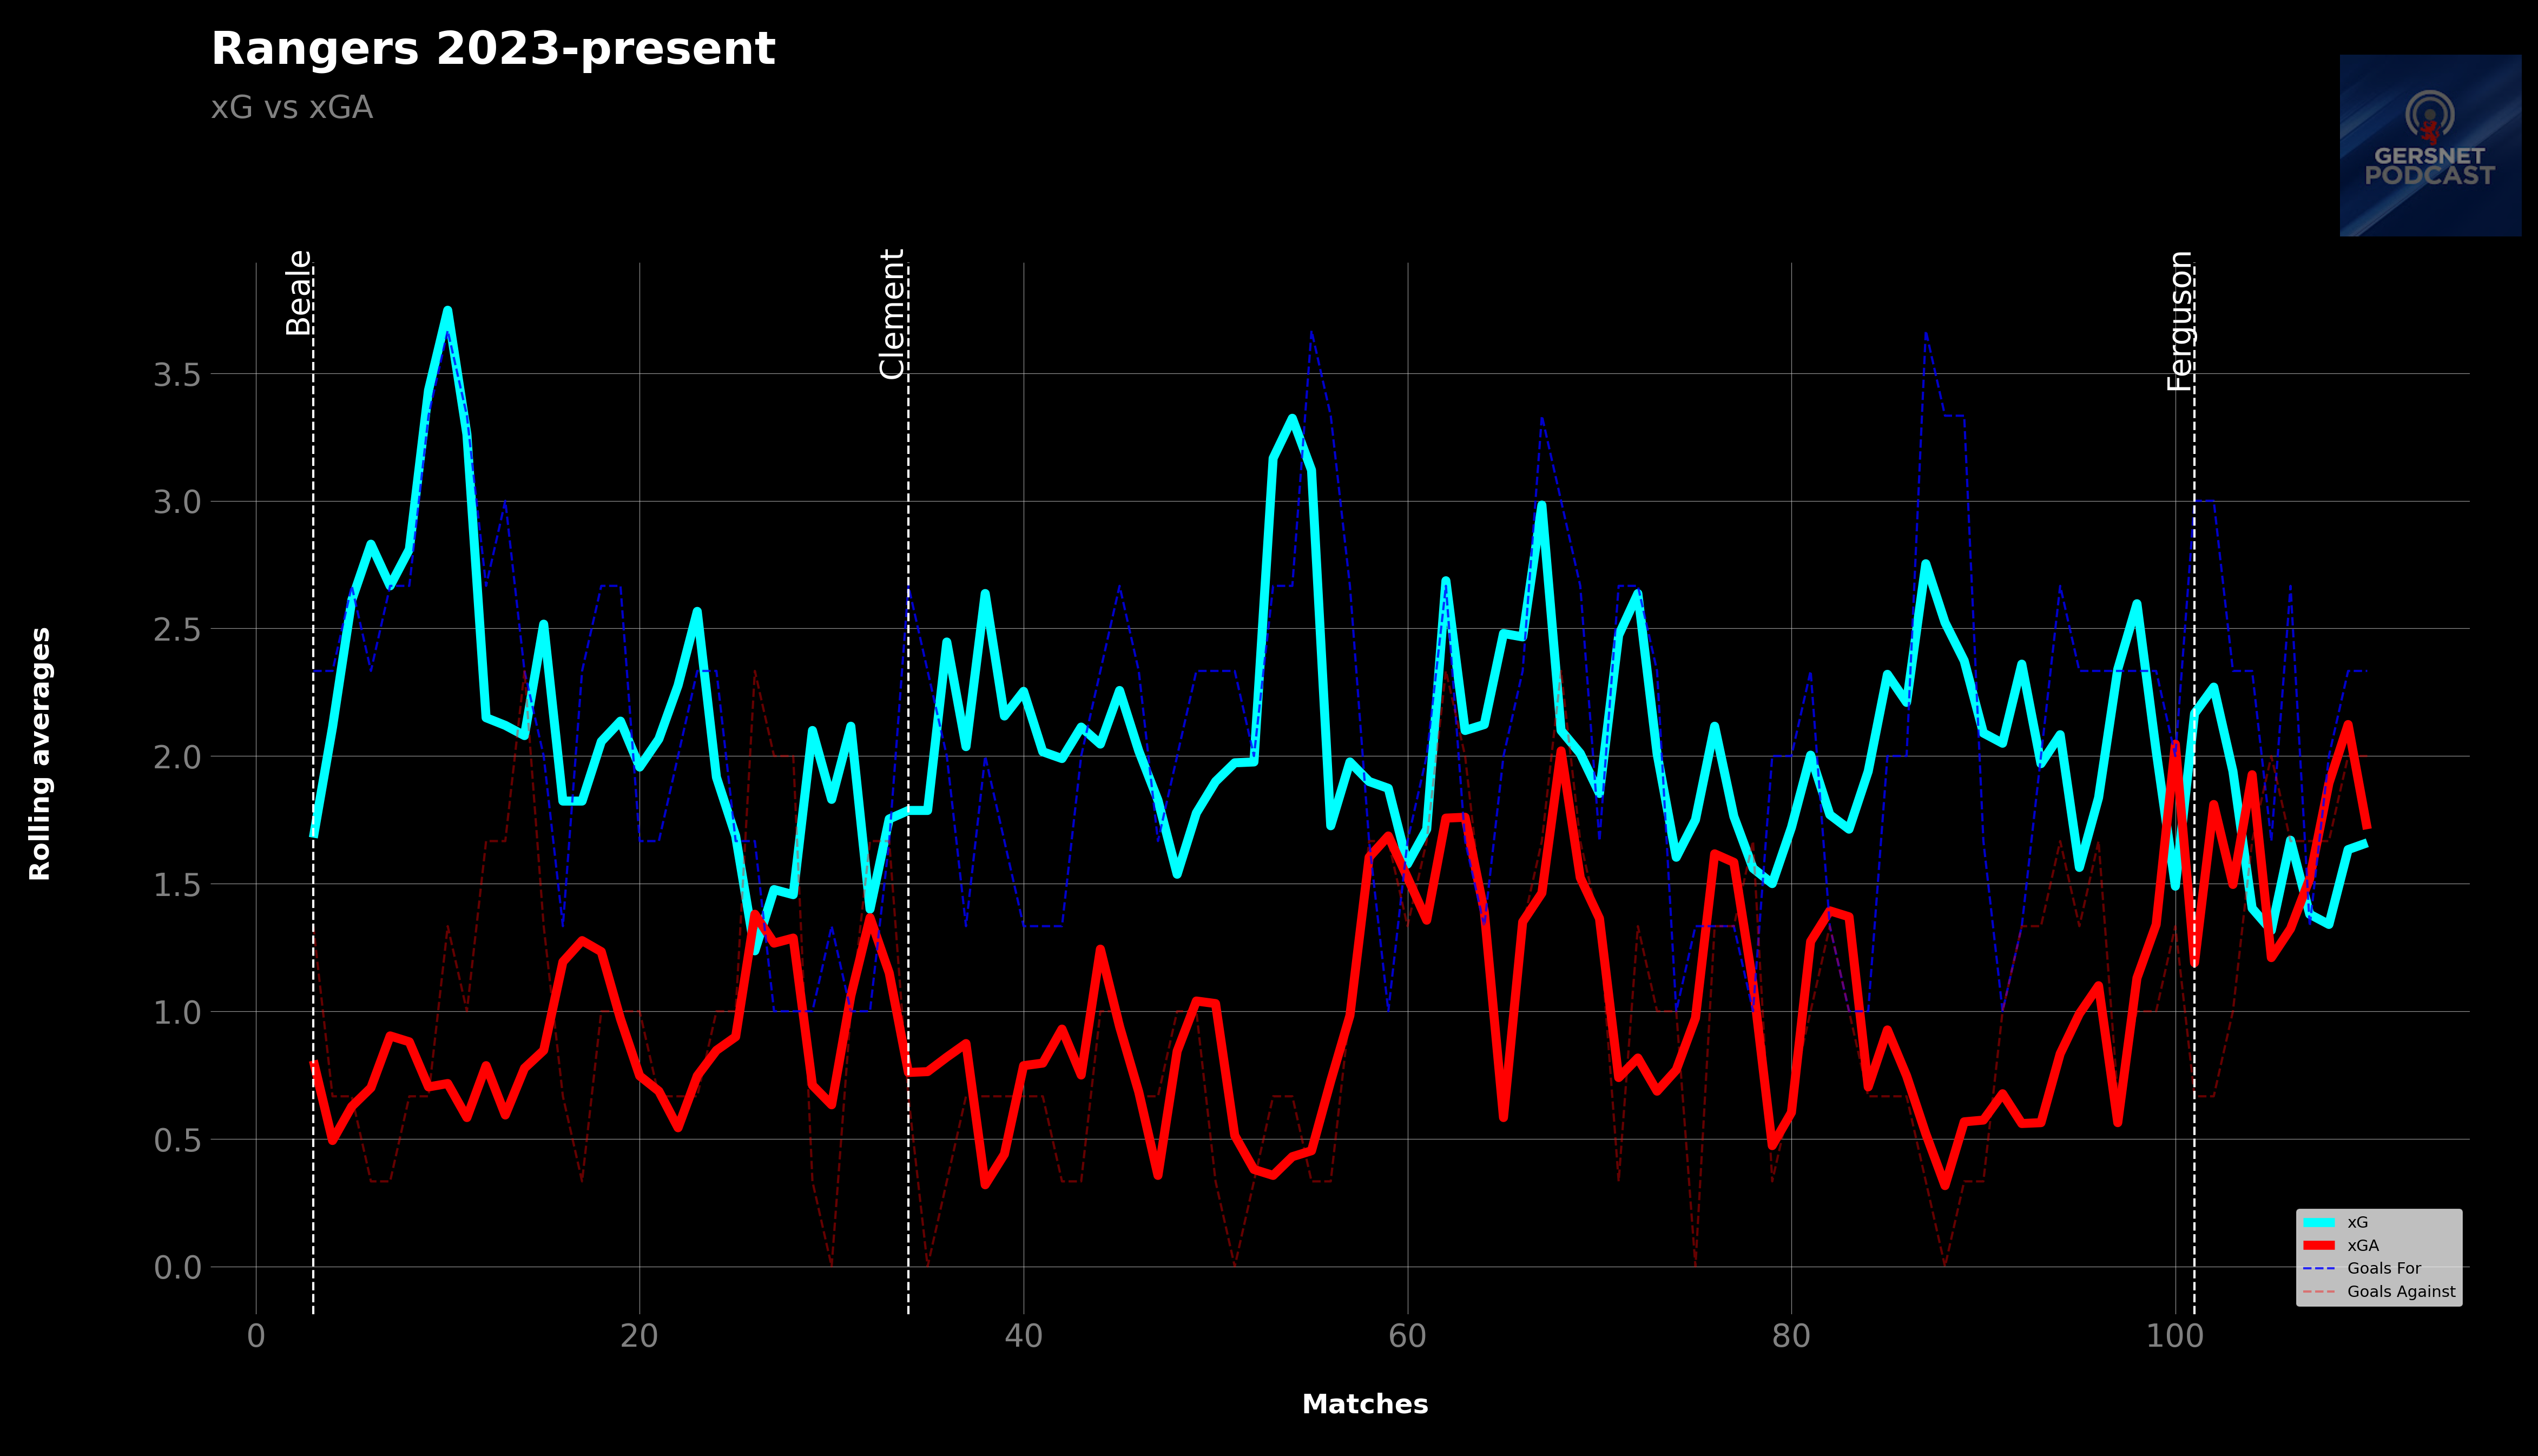
Exactly, yes. It'll increase if we create 'better' chances, and more chances. They're not considered 'easy' chances compared to the millions of similar shots on their database. To me it's a good barometer of how well the team is doing, in terms of creating chances. If our xG is generally high then there's a good chance of scoring more goals, and therefore winning. Conversely, when our xG was low under Beale I was concerned it didn't bode well. I may joke about deciding games on xG, but I'm not saying it is the be-all and end-all, just merely a good barometer of how well we create chances. Your criticism of Dessers aligns with mine.
-
If you are talking appearances, it's Morelos 0.46 goals per appearance vs Dessers' 0.45 goals per appearance. But I don't like that because a 2 minute spell is considered an appearance. Per 90, it's Morelos 0.56 goals per 90 mins vs Dessers' 0.65 goals per 90 mins. Dessers is the better goalscorer.
-
That would be really interesting, alas! my data source doesn't go back that far. It's probably there somewhere - well, Jelavic and McCoist at least - but you'd need to pay for it and I'm cheap.
-
All players. Otherwise it's meaningless. It's comparing millions of shots. xG measures the quality of a chance by calculating the likelihood that it will be scored by using information on millions of similar shots in the past. If you were to hypothetically put Fran Sandaza in the exact same position that Dessers was in, it would still be 12.52 xG. Because, historically, that's the result of millions of shots in the past. Sandaza was rubbish, so he'd score, say, 6 goals or fewer from that xG of 12.52. That difference would suggest he was rubbish - or really unlucky. If you were to substitute in Haaland or Ronaldo, they might score, say, 18 plus goals from that 12.52 xG. That difference would suggest they are good strikers. Haaland's first season at City saw him score 36 goals from an xG of 28.76, which is unbelievable. Subsequent seasons - which I think would align with most people's view - he hasn't quite been as clinical, he's hitting his xG quite closely. Obviously he's getting lots of chances, so he'll have a higher xG and he'll get more goals. The key thing is how they compare. I would expect a Rangers striker to hit their xG. I would also expect a Rangers striker to get lots of chances, so higher xG and high goals. However, our team is not creating good chances (hence the low xG), and few of them, at the moment. Dessers averages under 4 shots a game, which is not a lot, really. With Dessers, it feels like he misses good chances and scores more difficult ones. This link has more information, if you're interested: https://theanalyst.com/2023/08/what-is-expected-goals-xg
-
Those free-kicks from Rice were stunning.
-
Your arrogance is staggering. I'll leave you to it.
-
.thumb.png.933227737d9b1db3d025cd3f6cbbf371.png)
'Italian teams cannot cope with modern football’s intensity'
Rousseau replied to Uilleam's topic in General Football Chat
Nonsense. Atalanta are one of the most intense sides around - pumping one of the most intense German sides (Leverkusen) in last year's Europa League final. -
In my head, I also think he has been incredibly wasteful. But, I also think he has scored unbelievable goals (e.g. Dundee Utd) and missed absolute sitters. It's a perfect example of how our perceptions are not entirely accurate. The 12.52 xG is only in the league. So he is still under-performing. It's much worse in Europe: 3 goals from an xG of 5.33.
-
GPL Predictions Bluebear54's GPL 2024/25: Rangers vs Athletic Club
Rousseau replied to Rousseau's topic in Rangers Chat
Rangers 1 - 0 Athletic Club FGS Dessers -
Rangers vs Athletic Club
-
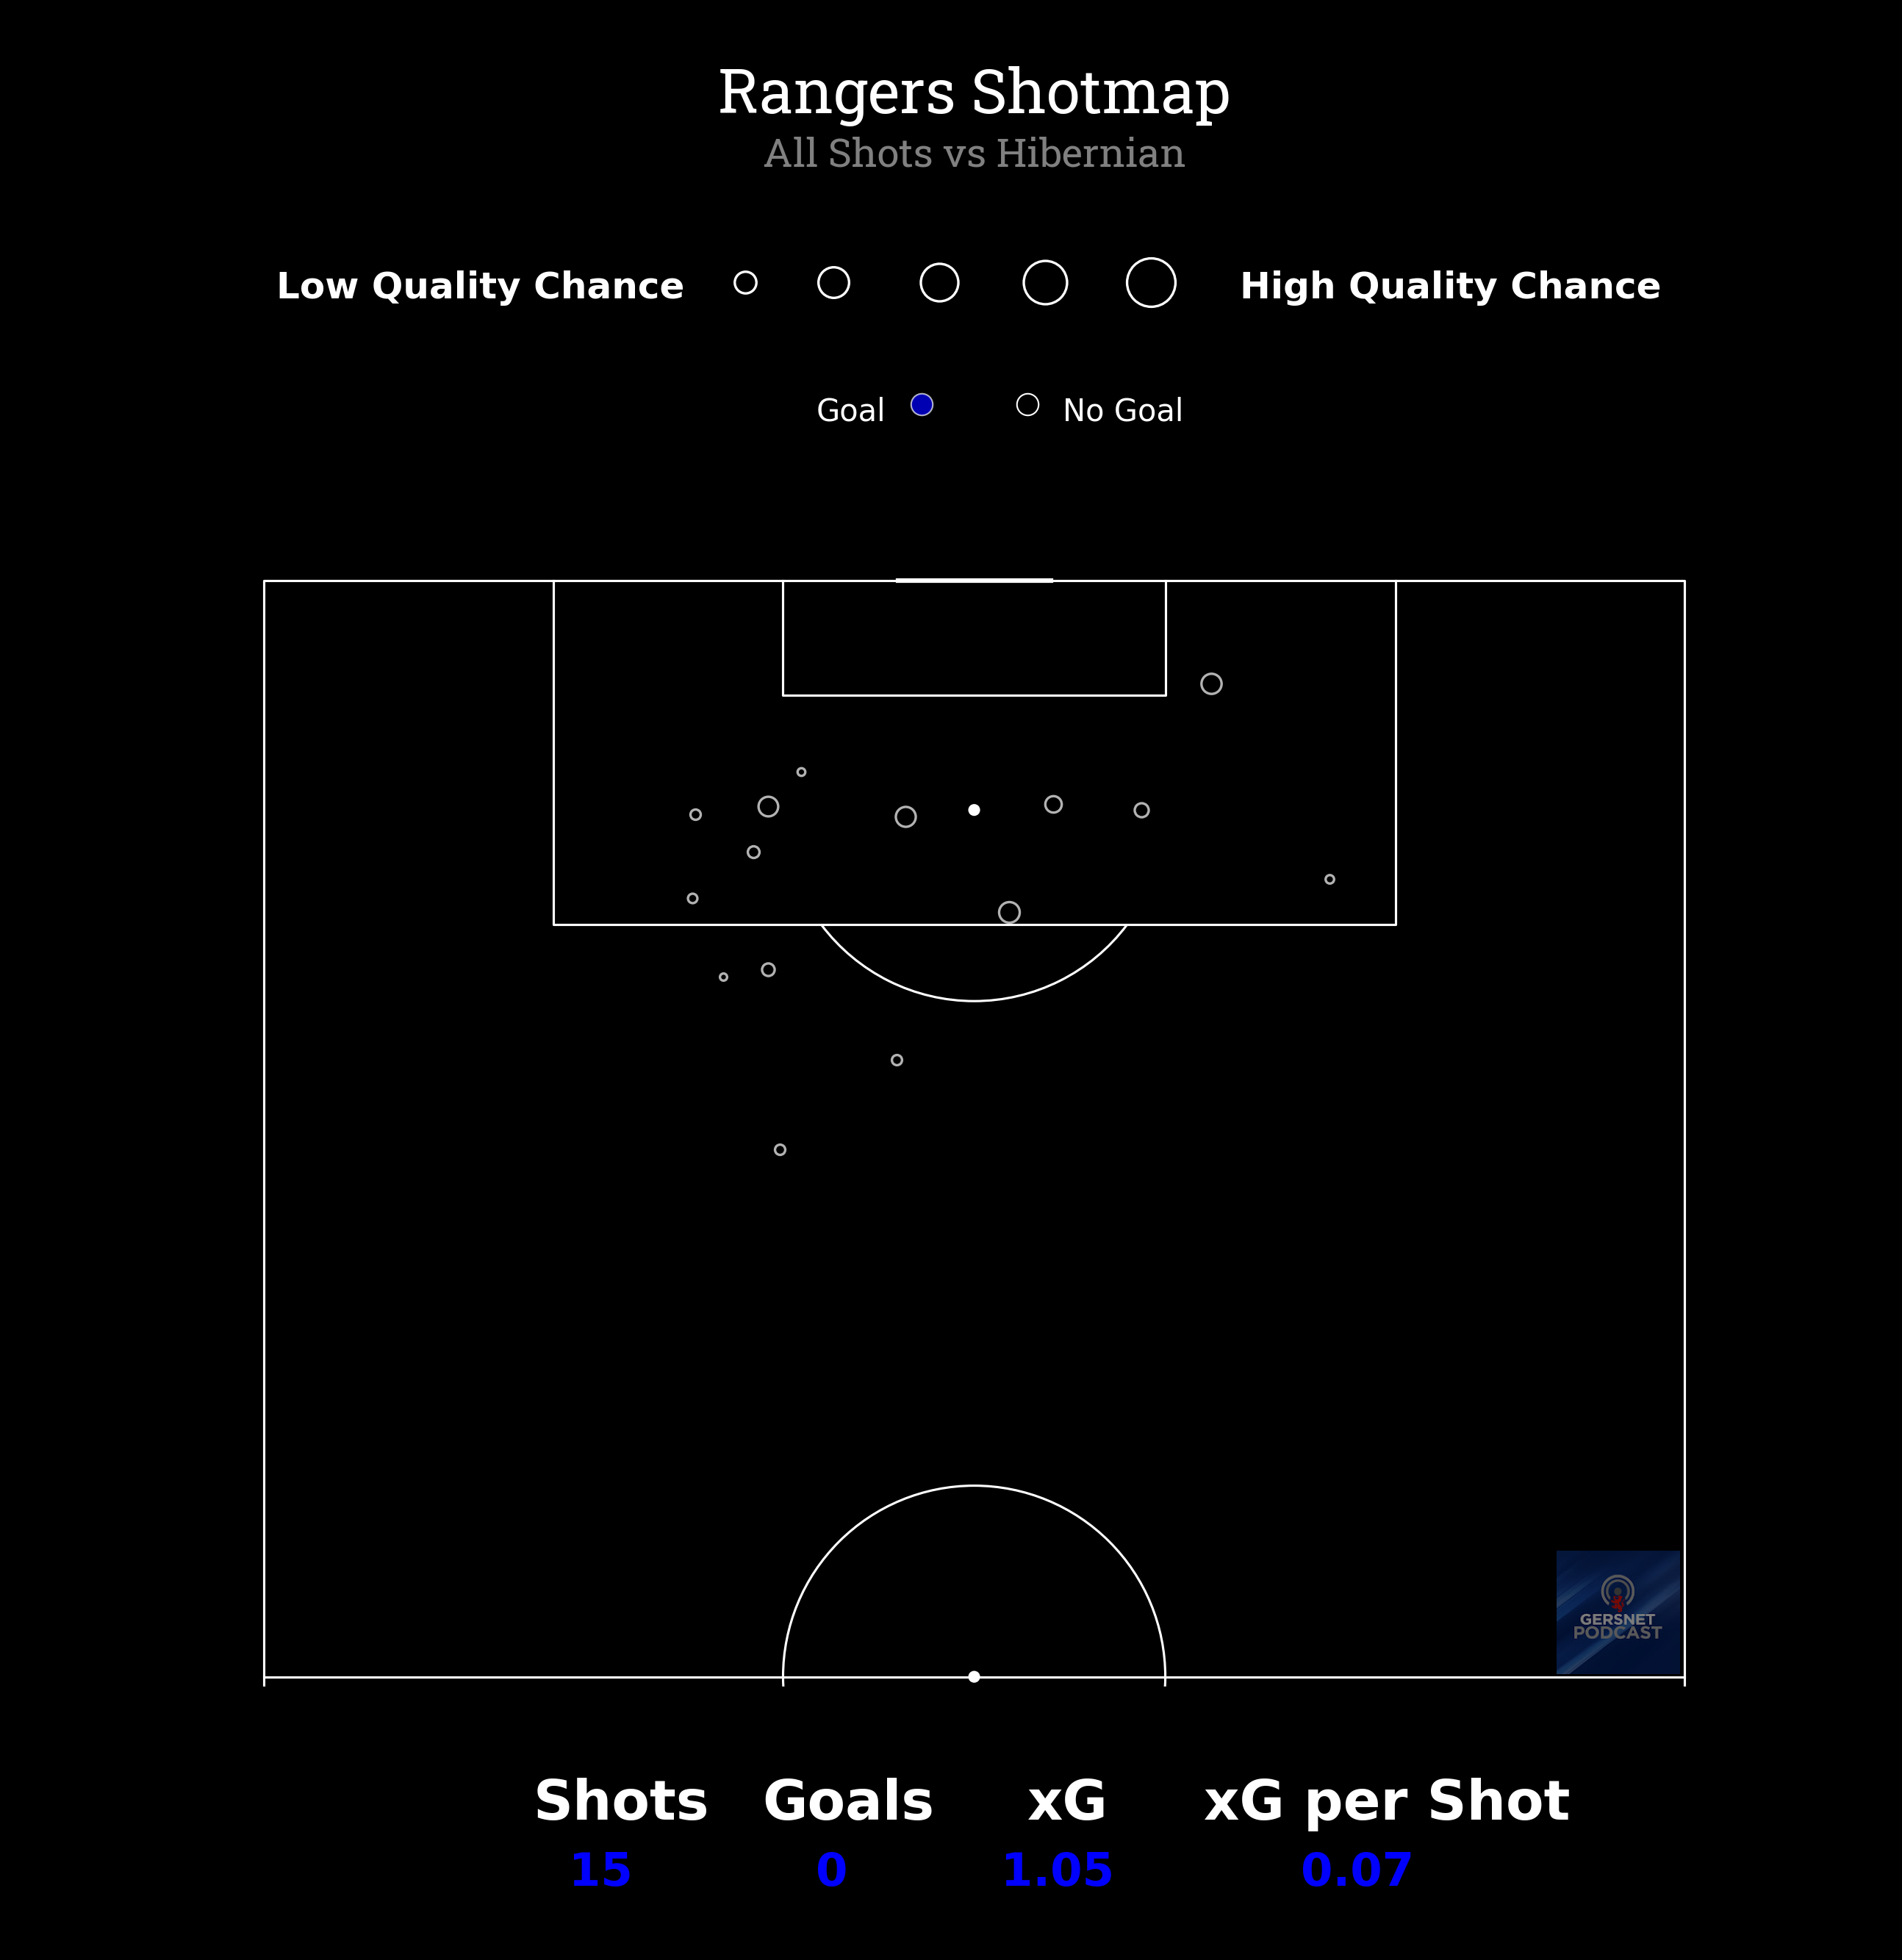
You're not grasping the mathematics of probability. Of course it will vary from match to match; it's not a big enough data set. xG is only useful over the medium to long term, which is why when using player xG, I take season data, not one-off games. That's true for goals scored, too: teams can score 8-9 goals in a single game, but that won't continue over every match in a season. I post single match shot maps and xG, like above, because I think it illustrates where shots are taken from and gives a general idea of the quality of the chances we've created. I don't draw any hard conclusions from it. All you're saying is your internal xG model is better than the mathematicians at Opta. If that's what you believe, then fair enough. I'm not going to argue with you. The Opta model has Dessers on 12.52 xG for the season. You seem to have him on 9 in the last 3 games alone. So he should be on about 54 goals from the 18 full matches he's played (1,674 mins) in the league? He has scored 12 goals. By all means keep calling it bollocks, but its accuracy is self-evident.
-
That's your opinion, though. We'll all have a different opinion of whether a player should have scored or not. This xG model tells you how many past players have actually scored from that type of shot - taking into account numerous variables of hundreds of thousands of shots. It's pretty accurate. A penalty has an xG of 0.79. Were Dessers' chances similar to a penalty? A free shot, centre of goal with no defenders around him? Dessers has an xG of 12.26 this season in the league. He has scored 12. Haaland has an xG of 21.40 this season in the league. He has scored 21. Can you beat that? Have you watched more than hundreds of thousands of shots? Are you able to take into account 20 plus variables?
-
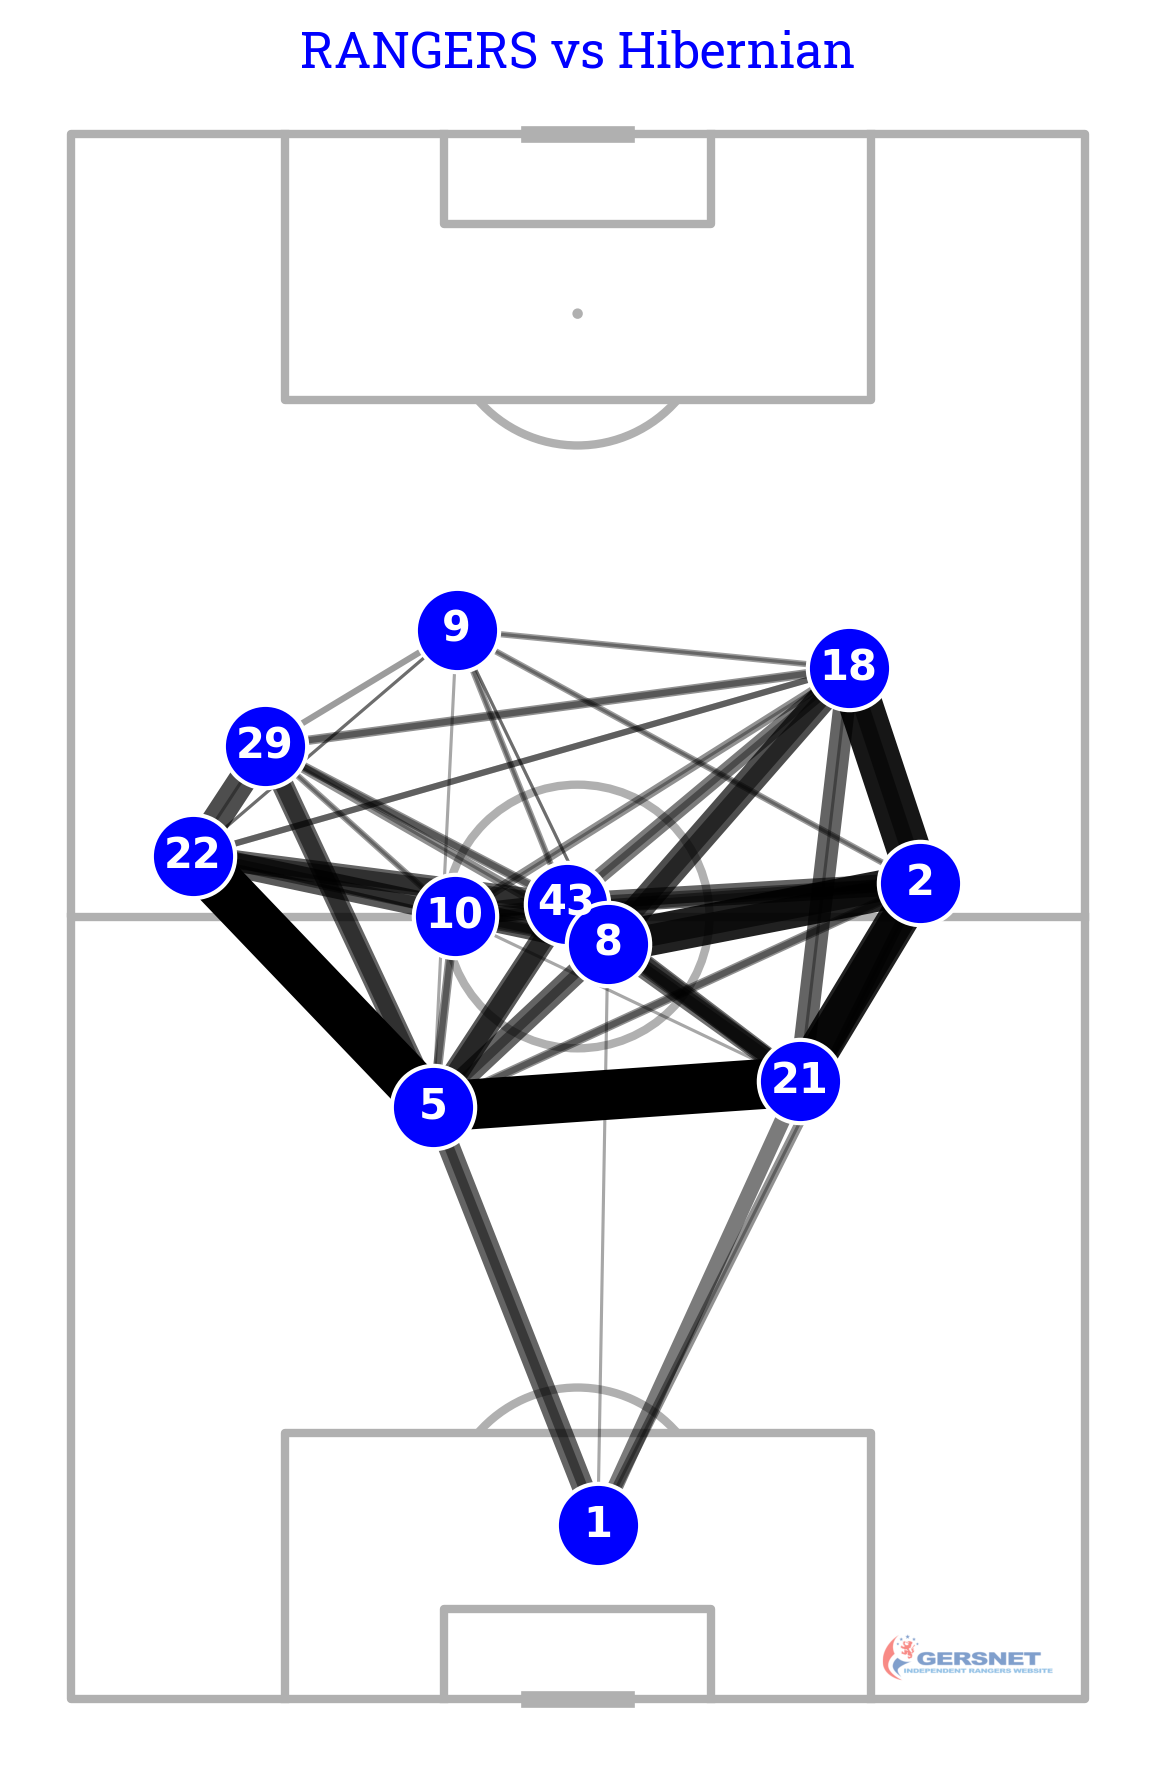
To be fair, the pass network shows he got very little service.
-
I've updated my xG data to include Ferguson's tenure. It's... not great...

-
-
The horseshoe!!
-
I don't have an issue with that in this instance. It was James Tavernier.
-
I'm glad you added that final sentence. Before that it was all too altruistic.
-
That's the ideal, I agree. We've not had a proper DoF model to really implement that, frustratingly.
-
I agree. He should have been let go at the end of the season.
-
So'ton relegated.
-
Perhaps. His contract must be close to ending?